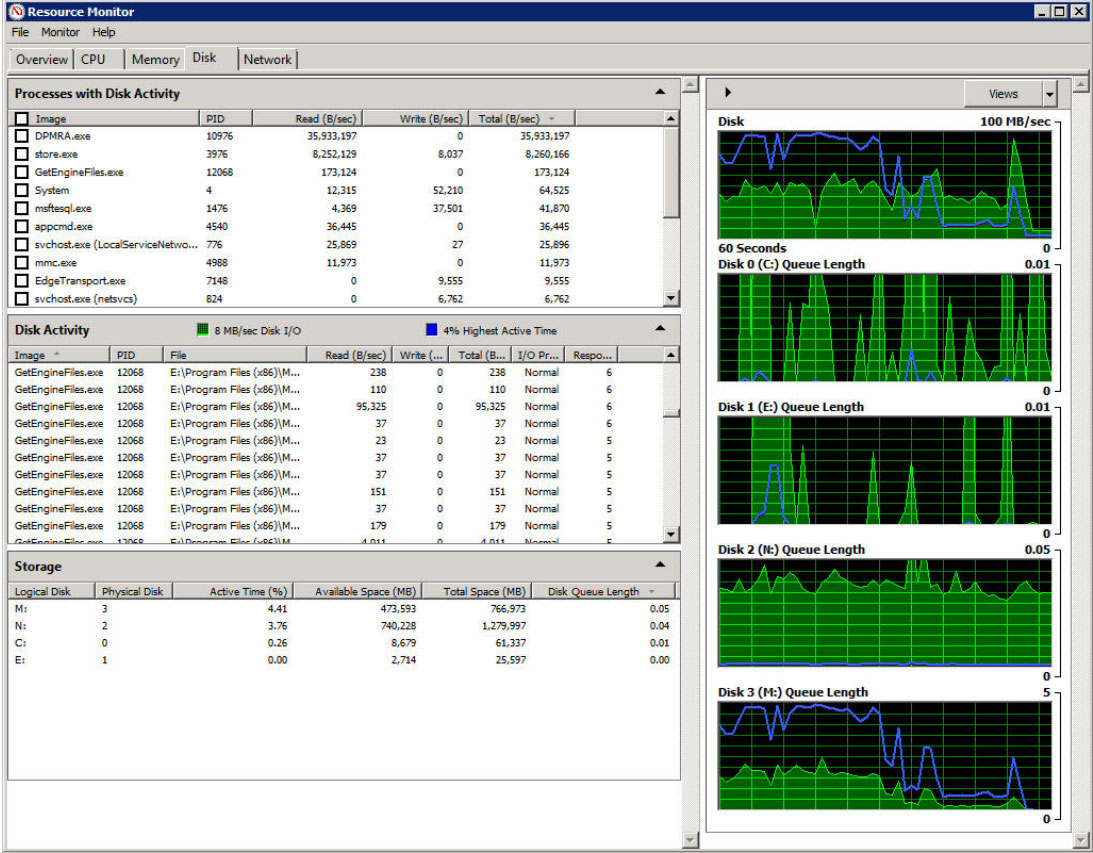
Monitor disk IO activities
To monitor disk IO activities in Windows in real time you need to start the Resource monitor. You can do that from the command prompt and the run function by typing: resmon The tool look depends on the Windows version, but the overall feel is the same.