Monitor Network performance in Windows with Resource Monitor

Monitor Network performance

To monitor Windows memory consumption in real time you need to start the Resource monitor. You can do that from the command prompt and the run function by typing: resmon

The tool look depends on the Windows version, but the overall feel is the same.

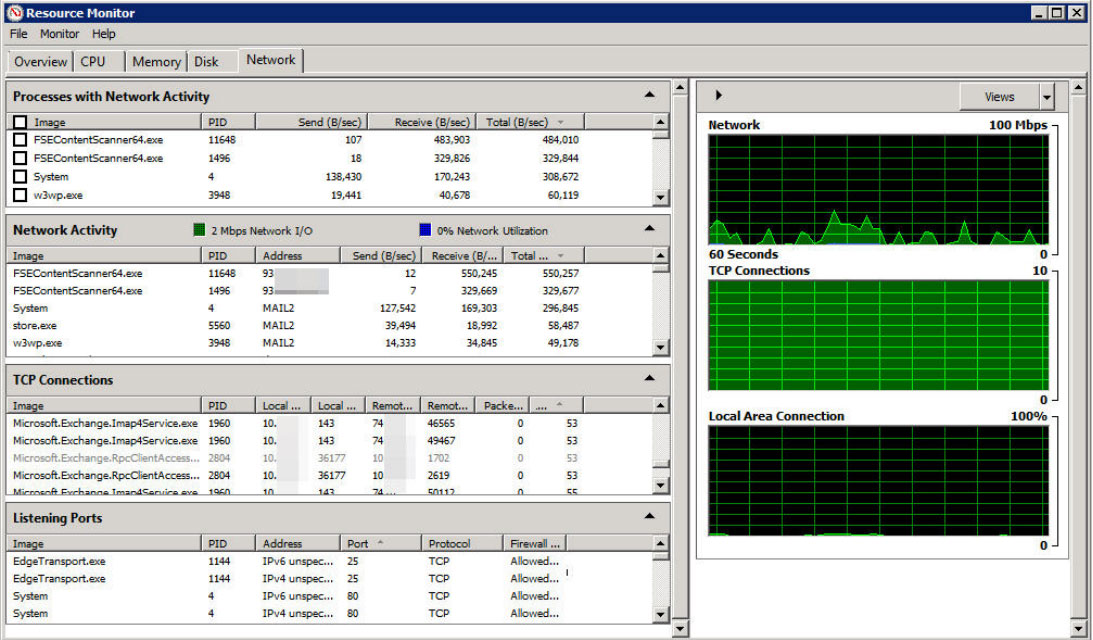
he statistics area occupies most of the window. Here is information about the metrics:

Processes with Network Activity

This section of the Resource Monitor window shows a list of all of the running processes that are using disk resources. You see the name of the executable and a number of performance statistics.

Image - Process executable file name. This is the name of the process that is actively using the disk.

PID - The ID number associated with the process. This is useful if you want to use other utilities to manage processes, or you want to easily match up processes with Task Manager.

Send (B/sec) - Average number of bytes per second that the process has sent over the network in the past minute.

Receive (B/sec) - Average number of bytes per second that the process has received from the network in the past minute.

Total (B/sec) - Average total network activity (in bytes) that the process has generated in the past minute.

The information in this section isn't particularly useful for troubleshooting except to show you which processes are consuming the most network resources.

Network Activity

This section of the Resource Monitor window provides more useful troubleshooting information. In particular, the two boxes next to the heading offer the most impactful, immediately useful metrics.

Network I/O - This box shows the current total network utilization in Mbps (megabits per second). This is a useful data point, but the metric next to it is the one that provides you with really good information.

Network Utilization - This metric wraps up all total utilization into a single, easily accessible metric that can help you determine exactly how loaded your network really is. If this number is approaching 100% and stays there on a regular basis, you likely have network congestion issues and should add more network capacity.

Below this header information, you will find the following new metric:

Address - This is the name or IP address with which the process is communicating.

TCP Connections

Local Address - Many servers have multiple network adapters, and each network adapter can have multiple IP addresses assigned to it. In order to better determine which network adapter and IP address may have congestion issues, this sections adds more granular IP address information to the list of metrics.

Local Port - Likewise, you may have services that run services using a multitude of TCP ports. If you'd like to determine on which ports communication is happening, you can see that here.

Remote Address - Every local connection requires some kind of communication with a remote system. In this column, you will see the remote address that makes up the other half of the communication stream.

Remote Port - Here you will find the remote port that makes up the other end of the communication.

Packet Loss (%) - This is a key metric. The more packet loss that you're experiencing, the worse the quality of the connection, and the more inefficiency that is introduced as a result of retransmissions.

Latency (ms) - This is another key metric. Latency is a measure of the time it takes for data to make it from point A to point B. The higher the number, the longer it takes.

High latency values can be detrimental to network-sensitive applications, such as real-time video. High latency values can also introduce noticeable delays to users, which can affect support desk call volume.

Listening Ports

Address - Some services are intentionally tied to specific local IP addresses for either IPv4 or IPv6. If that service is not tied to a specific address, this column will simply read **** unspecified.

Protocol - TCP (Transmission Control Protocol) or UDP (User Datagram Protocol). TCP is a guaranteed delivery mechanism, whereas UDP doesn't verify delivery.

Firewall Status - If your firewall is blocking traffic, you'll know that by looking at the information in this column.

The graphs

The Network graph shows the network bandwidth in use for the past 60 seconds for all connections.

The TCP Connections graph shows how many new TCP connections have been created.

An unexpectedly high rate of TCP connection creation can signal an out of control process, spyware, or some other problem.

The Local Area Connection graph shows overall network utilization as a percentage.