Monitor Memory Processes
To monitor Windows memory consumption in real time you need to start the Resource monitor. You can do that from the command prompt and the run function by typing: resmon The tool look depends on the Windows version, but the overall feel is the same.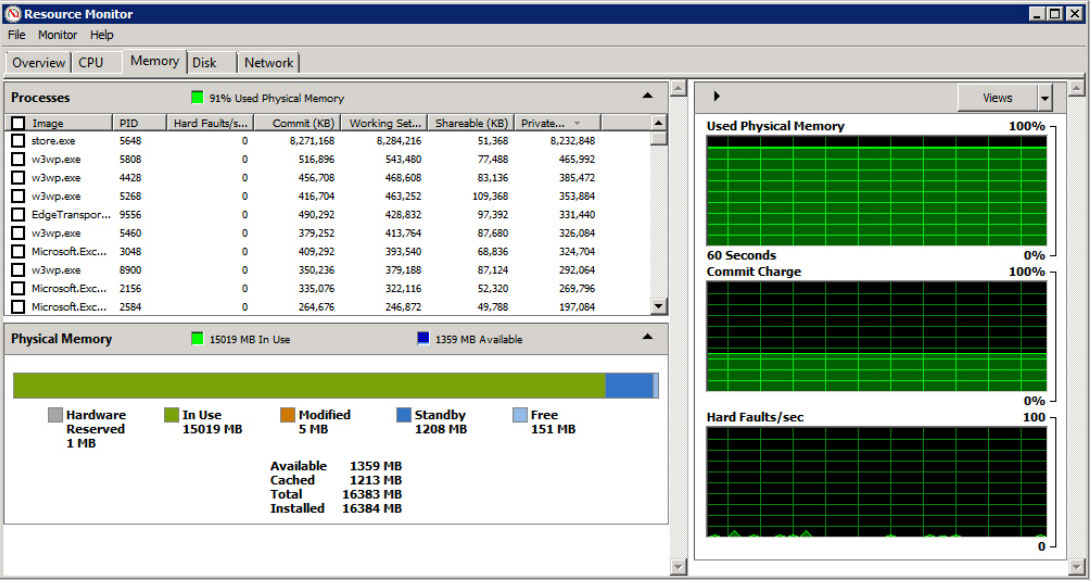 The Memory tab’s Processes section displays key metrics related to how the system’s processes use memory. Here is information about the metrics:
Image - Process executable file name. This is the name of the process that is actively using the disk.
PID - Process ID - This is the ID number associated with the process; it is useful if you want to use other utilities to manage processes, or if you want to easily match up processes with Task Manager.
Hard Faults/sec - A hard fault does not necessarily indicate a critical error condition, though it may indicate that the server is in need of more RAM. A hard fault occurs every time the system uses the swap file on the disk. This is important because disk storage is much, much slower than RAM, so each time the system uses disk-based virtual RAM; there is a significant performance penalty. If you see hard faults on a regular basis (especially if the numbers are large), you should consider adding more RAM to the server. Hard faults are sometimes referred to as Page Faults.
Commit (KB) - This is the total amount of physical and virtual memory (page file) that is committed to this specific process.
Working Set (KB) - This is the amount of physical memory that is committed to this particular process. This number should be the total of the next two metrics, which are its components.
Shareable (KB) - This is the total amount of physical memory that is committed to this particular process but that can also be shared with another process.
Private (KB) - This is the total amount of physical memory that is committed to this particular process but cannot be shared with another process.
The Memory tab’s Processes section displays key metrics related to how the system’s processes use memory. Here is information about the metrics:
Image - Process executable file name. This is the name of the process that is actively using the disk.
PID - Process ID - This is the ID number associated with the process; it is useful if you want to use other utilities to manage processes, or if you want to easily match up processes with Task Manager.
Hard Faults/sec - A hard fault does not necessarily indicate a critical error condition, though it may indicate that the server is in need of more RAM. A hard fault occurs every time the system uses the swap file on the disk. This is important because disk storage is much, much slower than RAM, so each time the system uses disk-based virtual RAM; there is a significant performance penalty. If you see hard faults on a regular basis (especially if the numbers are large), you should consider adding more RAM to the server. Hard faults are sometimes referred to as Page Faults.
Commit (KB) - This is the total amount of physical and virtual memory (page file) that is committed to this specific process.
Working Set (KB) - This is the amount of physical memory that is committed to this particular process. This number should be the total of the next two metrics, which are its components.
Shareable (KB) - This is the total amount of physical memory that is committed to this particular process but that can also be shared with another process.
Private (KB) - This is the total amount of physical memory that is committed to this particular process but cannot be shared with another process.