

- Log in to the Hosting Panel at https://clients.mochahost.com.
-
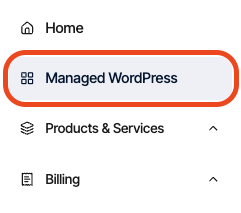
In the left sidebar, click Managed WordPress:
-
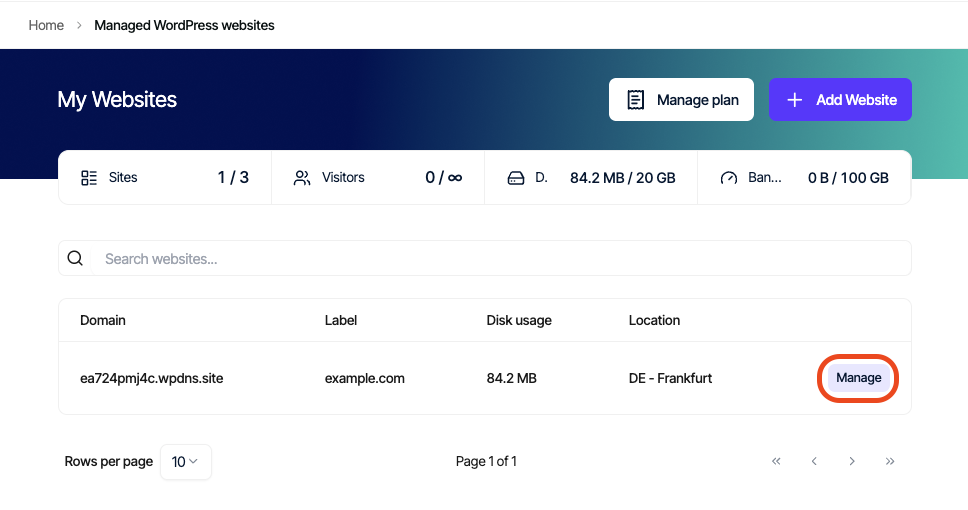
On the My Websites page, locate the site, and then click Manage:
-
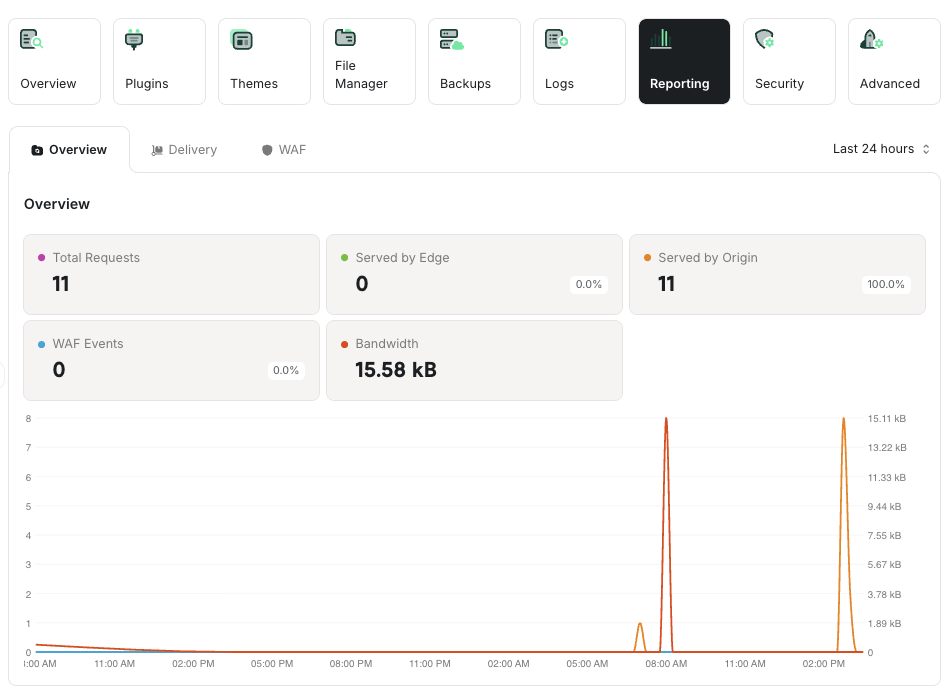
On the Mochahost dashboard, click the Reporting icon:
-
On the Overview tab, at the top right, in the Last 24 hours list box, select the amount of time covered in the bandwidth chart:
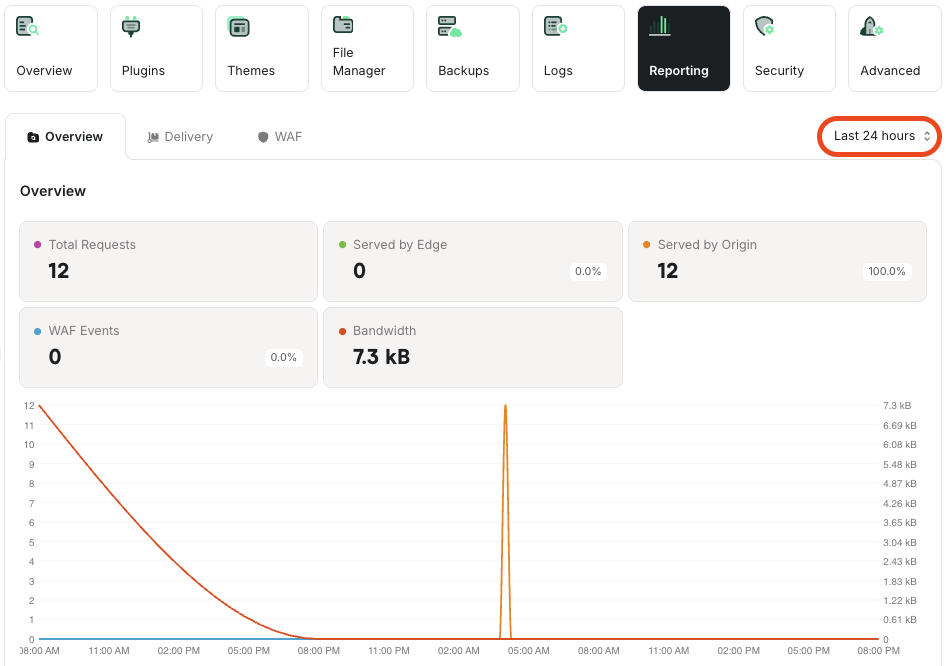
- To view bandwidth use for a specific day, hover over that date on the chart itself to see the exact amount used.
- Keep scrolling down to view analytics from Cloudflare’s Edge network to gain a greater understanding of the traffic going to your site from Cloudflare’s perspective.
Note
- For more information about these statistics, go to What is the difference between visitors on the Mochahost Dashboard and pageviews on Google Analytics?.
- For more information about Cloudflare Edge Analytics, go to https://rocket.net/blog/cloudflare-edge-analytics-for-wordpress/